
Uniswap Monthly Financial Report & Analysis - Nov 22
Uniswap Monthly Financial Report & Analysis - Nov 22
This Newsletter issue covers Uniswap DAO & Protocol Performance during Nov 22.
Table of Contents
November was a turbulant month for crypto, as FTX, a crypto centralized exchange, and Alameda Research, a crypto trading and investment firm, two major players in the industry collapsed. The downfall caused trouble for other major institutions in the industry as well (BlockFi, Genesis…)
Crypto prices had a correction as the FTX story was unfolding (ETH lost 35% between Nov 6th and Nov 10th, and UNI lost 40%), then ranged for the rest of the month.
Due to the aforementioned market volatility, DEXs trading volumes spiked on November breaking the downtrend that started during the summer.
So how did Uniswap Protocol & DAO perform during this infamous month? And, how do November metrics compare to previous months?
Financial Statement
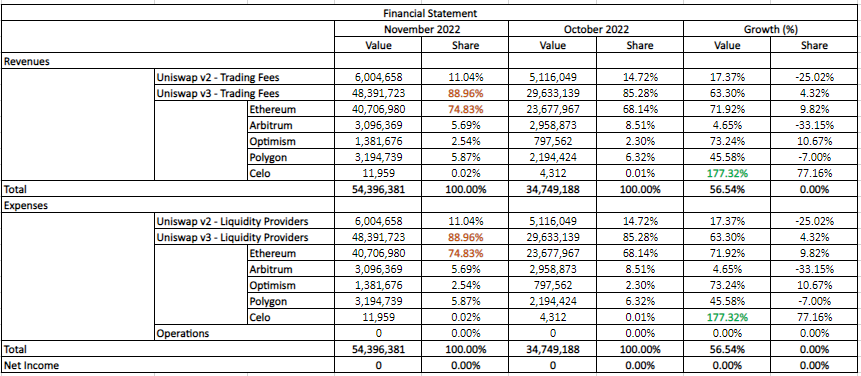
Uniswap generated 54m USD in Trading Fees during November, up 56% MoM.
Uniswap v3 contributed 89% of the revenues with 75% coming from Uniswap v3 - Ethereum.
Trading fees on Celo were up 177% MoM at 12k USD.
No treasury expenses were executed by Uniswap governance during the month.
Net Income is null for the month as all trading fees went to liquidity providers.
Trading Volume / Chain Analysis

50B USD in trading volume was executed on Uniswap during November, up 71% MoM.
Uniswap v3 contributed 96% of trading volume, up 74% MoM with 40B USD coming from Uniswap v3 Ethereum (80% of Uniswap trading volume).
Trading Volume is up across all chains, with a special mention of Celo that doubled is volume MoM.

Polygon and Arbitrum are starting to facilitate more trading volumes than Uniswap v2.

USD volumes on Uniswap v2 are down more than 90% from November 2021.
→ This is due to Uniswap v2 trading volume being dominated by Small Cap tokens which are down more than 90% in USD terms since November 2021 (ATH for crypto prices). If USD prices are down 90%, it takes 10 the volume to be at the initial levels.
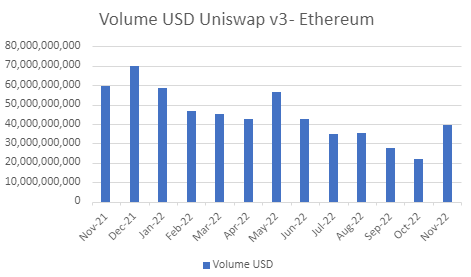
USD Volume on Uniswap v3 - Ethereum has been downtrending since the start of the year with the exception of May & November.
The main Uniswap deployment facilitated the execution of x USD since the start of the year (on average, y USD daily volume 334).
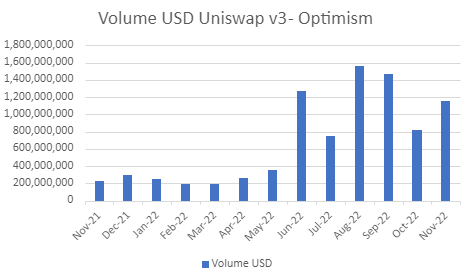
Trading Volume on Uniswap - Optimism is up since the OP token arrival.
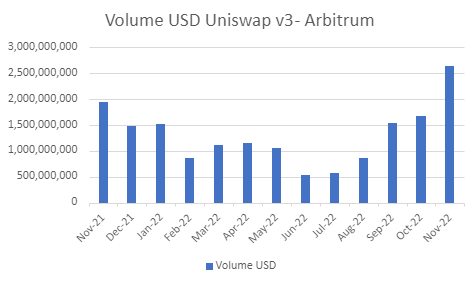
Trading Volume on Uniswap - Arbitrum is at its high for 2022 after a nice uptrend since the start of the summer.
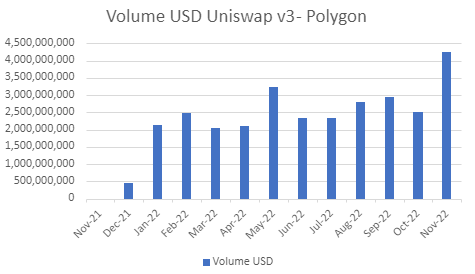
Trading Volume on Uniswap - Polygon recorded a new monthly ATH during November.
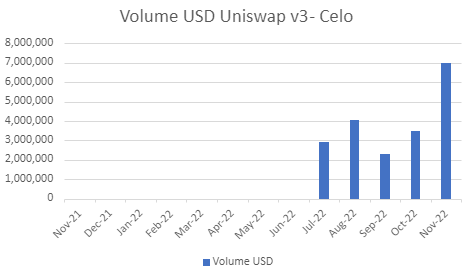
Monthly Trading volume on Celo is also at its ATH but still small compared to the other chains.
Trading Fees / Chain Analysis

Uniswap v3 on L2s contributed 14% of revenues to LPs during November, higher than Uniswap v2 (11%).
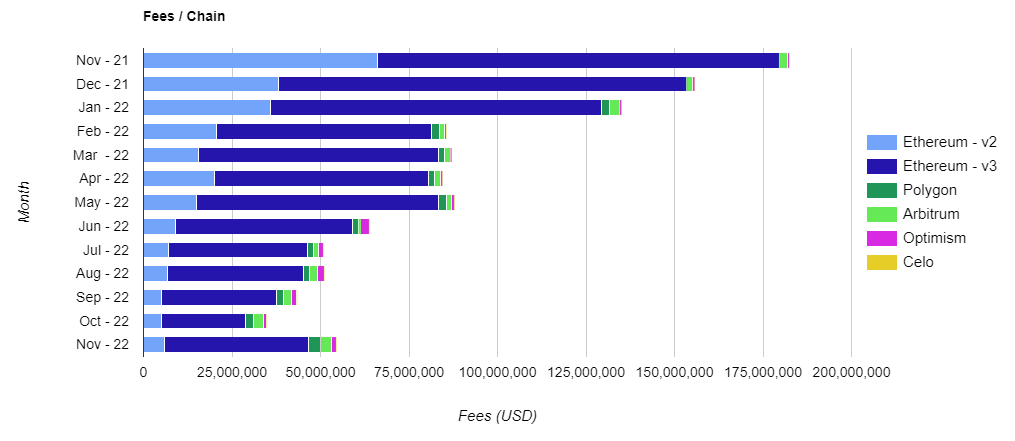
Fees generated by Uniswap have been trending lower since the start of the year, impacted mainly by Uniswap - Ethereum (v2 & v3).
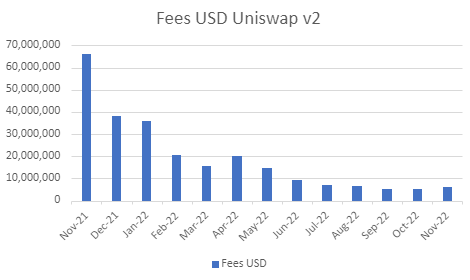
Similar to trading volume, fees on Uniswap v2 have been downtrending since the start of the year and seem to have found a bottom.

Fees generated by Uniswap v3 - Ethereum have been trending lower since the start of 2022. Fees for November are, however, higher than the previous 4 months.

Fees generated on Optimism during November are up compared to October and most of the year, but still haven’t managed to get a position in the podium.

New 2022 high for monthly fees generated on Arbitrum recorded on November.
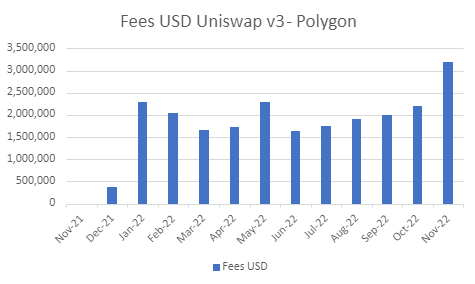
ATH for monthly fees generated on Polygon reached on November.
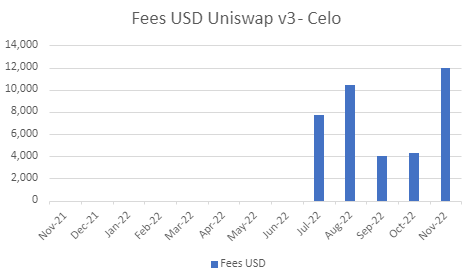
ATH for monthly fees generated on Celo attained on November.
Liquidity / Chain Analysis
Monthly Liquidity is defined as the Average Daily Liquidity during the month.
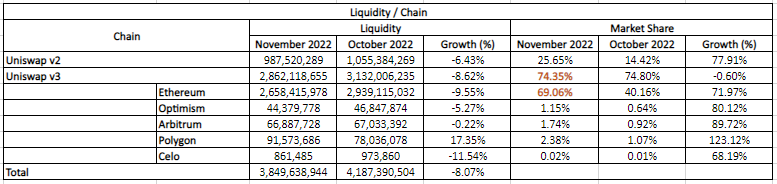
Total Liquidity on Uniswap for November was around 3.8BUSD down 8% MoM.
Polygon had an increase in liquidity during November despite the correction in crypto prices.

Liquidity on Uniswap has been trending lower since the start of the year, impacted mainly by Uniswap v2.

Liquidity on Uniswap v2 is down more than 80% since Nov 21.
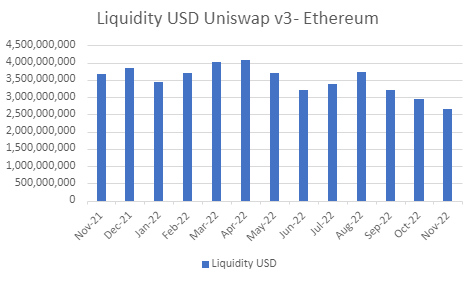
Liquidity on Uniswap v3 - Ethereum recorded a monthly low for 2022 during November.
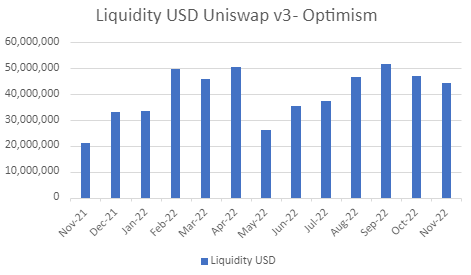
Liquidity on Uniswap - Optimism has been in the range of 30-50m USD for most of 2022.
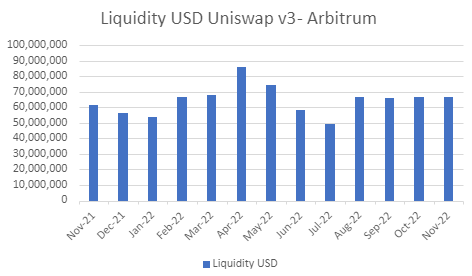
Liquidity on Uniswap - Arbitrum has been in the range of 50-70m USD for most of 2022.
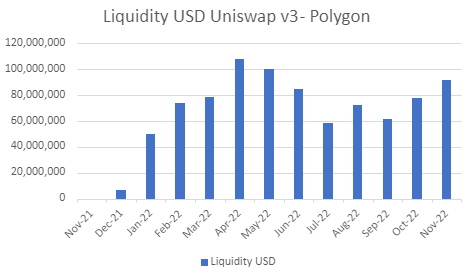
Liquidity on Uniswap - Polygon managed to get the bronze position for 2022 during November.

Liquidity available on Uniswap - Celo has been trending lower since August.
Uniswap v3 - Ethereum Analysis
Market Analysis

Uniswap v3 had 66% market share of Ethereum DEXs Trading Volume during Nov, down 11% MoM. Curve had a record 277% increase in trading volume MoM.

Traders are defined as the original transaction senders. i.e the address that pays the transaction fee.
Uniswap v3 had 46% market share of Ethereum traders, second to Uniswap v2 that controled 48%.
→ Uniswap v2’s high market share is due to retail traders swapping small cap tokens mainly available on this protocol version.

Uniswap v3 had 28% of liquidity available on Ethereum DEXs, second to Curve which controled 46%.
Quote Assets Analysis
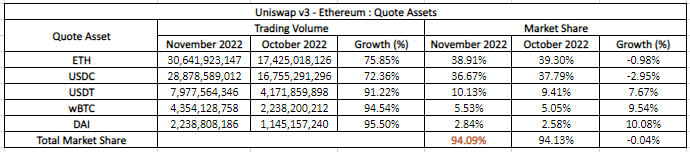
Quote assets are popular tokens used to “quote” base assets.
For the Ethereum Ecosystem, the quote assets are : ETH, USDC, USDT, wBTC and DAI.
The 5 quote assets combined facilitated 94% of trading volume on Uniswap v3 - Ethereum during Nov. i.e 94% of trading volume was executed to and / or from the aforementioned assets. ETH and USDC combined facilitated around 76%.
Quote Assets Pairs Analysis
Quote assets pairs pools facilitate both direct trading (Quote Asset 1 →Quote Asset 2) and indirect trading (Base Asset 1 →Quote Asset 1 →Quote Asset 2 →Base Asset 2).

Uniswap v3 facilitated 42% of USDC/USDT Trading Volume on Ethereum challenging Curve’s 56% market share during Nov 22. The pair pools represented 12% of November trading volume on Uniswap v3 - Ethereum.
Uniswap v3’s market share of the pair’s Trading Volume declined 42% as Curve’s volumes rose 691% MoM.

Uniswap v3 had 2% market share of DAI/USDT Trading Volume on Ethereum during Nov. Curve dominated the pair with 95% market share.
Both Uniswap v2 & v3 had a decline in the pair’s trading volume MoM, while Curve and Balancer recorded triple digits growth.

Uniswap v3 dominated the ETH/USDT volumes of November with 70% market share. The pair represented 7% of Uniswap v3 - Ethereum total Trading Volume.

The wBTC/USDT pair is mainly traded on Curve and Uniswap v3. Curve dominated with 96% market share for the month.

Uniswap v3 had 12% market share of DAI/USDC trading volume on Ethereum. Maker PSM dominated this pair’s trading volume with 76% market share.
→ DAI/USDC trades executed through aggregators will be routed automatically to the PSM due to the absence of slippage and trading fees.

ETH/USDC pools trading volume represented 52% of Uniswap v3’s total Trading Volume during November.
Uniswap v3 dominated the pair on Ethereum with 98% market share, with Uniswap v2 contributing the rest.
→ ETH/USDC is the king of Uniswap Volumes and Uniswap is the king of ETH/USDC Volumes.

100% of wBTC/USDC Trading Volume on Ethereum during November was facilitated by Uniswap v3.

ETH/DAI Trading Volume was up triple digits MoM during November on both Uniswap and Balancer.
Uniswap v3 dominated the pair’s trading volume on Ethereum with 90% market share.

100% of wBTC/DAI Trading Volume on Ethereum during November was executed through Uniswap v3.

Uniswap v3 dominated ETH/wBTC Trading Volume on Ethereum during November with 94% market share. The pair’s trading volume was up triple digits MoM on both Uniswap v3 and Curve.

The pools of the 5 quote assets pairs contributed 88% of Uniswap v3 trading volume on Ethereum and 72% of Curve’s during November.
→ Both Uniswap v3 and Curve deployed on Ethereum are dominated by Top Tier assets.
The pools contributed 26% of Uniswap v2’s trading volume and 17% of Balancer’s during the same period.
→ Uniswap v2 and Balancer are dominated by Long Tail Assets.
Pools Analysis

The Top 3 Pools on Uniswap v3 - Ethereum by trading volume during November represent the trading pools and fee tiers universe very well :
ETH / USDC 5bps : Volatile Asset / StableCoin - The 5bps is the winner fee tier for a major volatile asset like ETH coupled with a major StableCoin like USDC.
→ This pool alone contributed 46% of Uniswap v3 - Ethereum and 37% of Uniswap Protocol trading volume.
USDC / USDT 1bp : StableCoin / StableCoin - The 1bp tier is the winner as this is a stable pool.
ETH / wBTC 5bps : Volatile Asset / Volatile Asset - The 5bps fee tier is the winner as both ETH & wBTC are major assets.
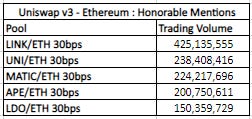
After the pools comprised of the 5 quote assets mentioned before, comes diverse pools that represent most of the industry :
Oracles : Chainlink (LINK)
DEXs : Uniswap (UNI)
Layer 2s : Polygon (MATIC)
NFTs : BAYC / MAYC (APE)
Staking : Lido (LDO)
→ The tokens above appear mainly in pools coupled with ETH on the 30bps fee tier.