
Compound Monthly Financial Report & Analysis - Feb 23
Compound Monthly Financial Report & Analysis - Feb 23
This Newsletter issue covers Compound DAO & Protocol Performance during Feb 23.
Table Of Contents
Governance & Markets Recap
It was a quiet month for Compound On chain governance, the community voted mainly on risk parameters & collateral caps updates.
On the forum, v3 deployment on L2s (Polygon, Arbitrum and Optimism) was a main discussion point among community members.
It was a quiet month for crypto markets as well with both BTC & ETH finishing the month flat, while COMP lost 6% closing the month around 50 USD.
Supply & Borrowing Analysis

Data Source : DefiLlama & Dune Analytics
Altough it was a quiet month for crypto, Compound had upticks on both supply & borrowing across all deployments.
Excluding v3 collateral, on average, Compound had around 2.5B USD supplied across all markets, of which 91% on v2.
On average, compound had 870m USD borrowed across all markets, of which 83% from v2.
v3 USDC contributed 7% of Assets Supplied (Collateral Excluded) and 14% of borrowing.
Data Source : DefiLlama
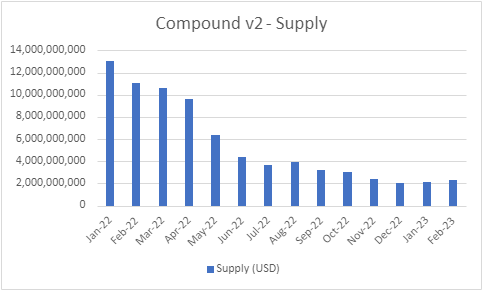
Compound v2 supply has been trending lower since the beginning of 2022 but seems to have found a bottom with the protocol deployment recording single digit monthly upticks since the start of 2023.
Data Source : DefiLlama
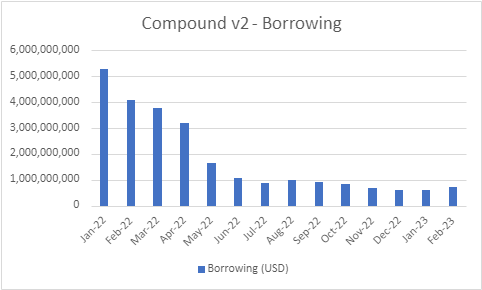
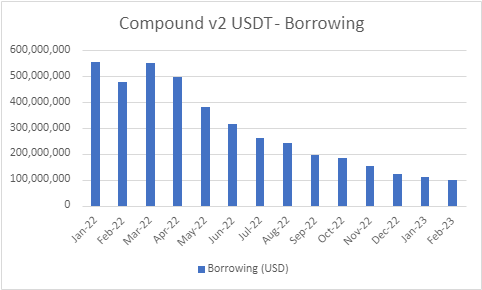
Borrowing on Compound v2 had been ranging below 1B USD since July 2022. On February, the protocol deployment recorded a 20% MoM uptick in borrowing volume.

Data Source : DefiLlama
The utilization ratio is defined as borrowing divided by supply. Since suppliers all share the fees paid by borrowers no matter how much of their supplied assets are utilized, they benefit from higher utilization ratios.
Borrowers on the other hand, pay higher fees when the utilization ratio goes beyond an optimal level defined by Compound governance, usually around 80%.
Compound v2 utilization ratio has been ranging between 20-40% since the start of 2022, favoring borrowers.
Data Source : DefiLlama & Dune Analytics
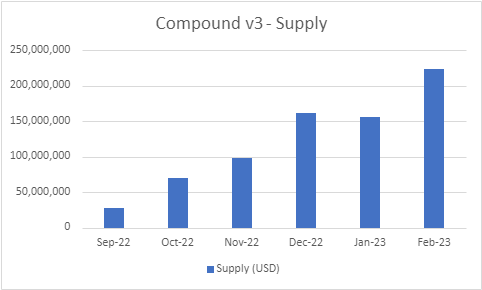
Compound v3 supply (excluding collateral) had a nice uptick during February benefiting from the arrival of ETH market at the end of January.
v3 contributed around 9% of assets supplied on Compound during February. This is a conservative supply share, since assets supplied as collateral are not counted as opposed to v2.

Data Source : DefiLlama & Dune Analytics
Borrowing on v3 has been trending higher since the protocol version was deployed just over 6 months ago.

Data Source : DefiLlama & Dune Analytics
v3 utilization ratio has been ranging between 50-70% for the last 6 months. This is good news for v3 suppliers. v3 borrowers are not penalized either, as long as the utilization ratio doesn’t go above its optimal level.
Revenues Analysis
Data Source : Token Terminal
v2 Suppliers generated around 1.7m USD during February, up 24% MoM, benefiting from the uptick in borrowing volume during the month.
v2 borrowing generated 200k USD for the protocol reserves during February (around 2.5m USD annualized).
Treasury & Expenses Analysis

Data Source : Dune Analytics, FlipsideCrypto & On Chain Governance
As of the end of February, the protocol had 133m USD in its treasury (Reservoir, Comptroller and Timelock) of which 93% in COMP, with the rest mainly in ETH (8m USD).
The DAO paid 600k in operational expenses during February (3x v2 protocol revenues) and around 1.7m USD in incentives.
Focus 1 : Compound v2 Main Markets Analysis

Data Source : DefiLlama
ETH supply on Compound v2 has been below 1B USD since July 22. ETH is usually useed as collateral to borrow Stablecoins for leverage. Because of the bear market, as demand for leverage decreased so did ETH supply.

Data Source : DefiLlama
ETH is borrowed from Compound for two main reasons : Shorting and Recursive Farming where users would supply and borrow ETH to farm COMP incentives.
ETH borrowing on Compound has been limited since June 2022 except for September as users borrowed ETH to get ETHPoW forks airdrops.

Data Source : DefiLlama
Since the beginning of 2022, less than 10% of ETH supplied on Compound v2 has been borrowed. ETH is mainly used as collateral to borrow stablecoins and shorting the innovation is a risky business.
Data Source : DefiLlama
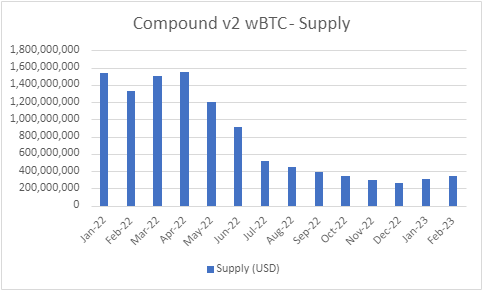
Similar to ETH, wBTC is also used as collateral to borrow stablecoins but with the added risk of centralization.
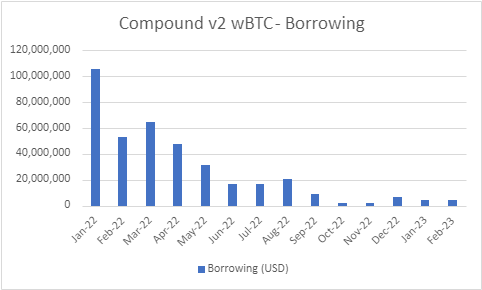
Data Source : DefiLlama
wBTC borrowing on v2 dried up since September as COMP incentives were reallocated towards v3USDC.
Data Source : DefiLlama
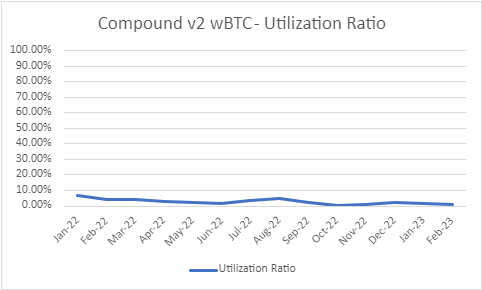
wBTC utilization ratio has been tending towards zero since the beginning of 2022, but this isn’t surprising.
Data Source : DefiLlama
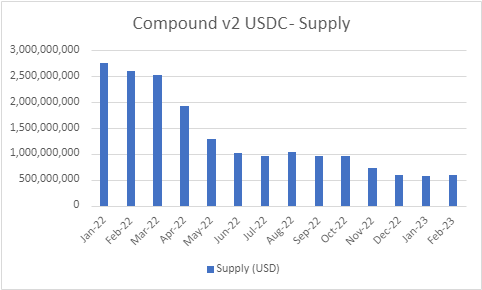
Attracting StableCoins supply is important for Lending protocols like Compound since they are mainly used to borrow stablecoins against volatile assets (usually ETH & wBTC).
COMP incentives have been an important lever to attract StableCoins liquidity to the protocol especially during the bear market where yield generated from leverage users dries up.
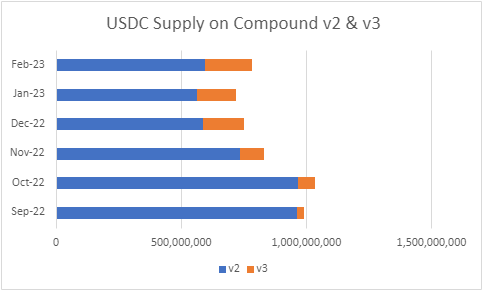
USDC supply on v2 almost halved since the arrival of v3USDC despite the absence of incentivization for such migration as only v3USDC borrowers are rewarded.
Data Source : DefiLlama
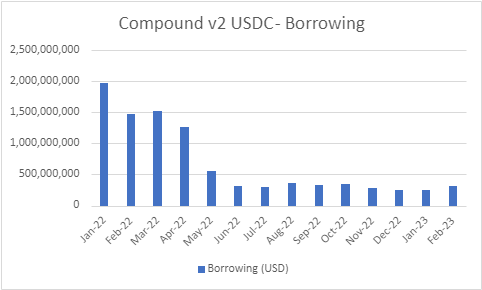
USDC borrowing wasn’t impacted by the introduction of v3. Both v2 and v3 USDC borrowers are incentivized.

Data Source : DefiLlama
v2 USDC utilization ratio has been uptrending slowly since June 22. This isn’t due to increase in borrowing but rather a decrease in supply. USDC liquidity providers that stuck with Compound have been getting rewarded.

Data Source : DefiLlama
Unlike USDC supply that had a sharp decrease after the LUNA/3AC Collapse, USDT supply has been trending slowly lower since the start of 2022 without any major sharp declines.
Data Source : DefiLlama
The pattern with borrowing is similar to Supply. It seems that USDT liquidity providers on Compound have their own agendas.

Data Source : DefiLlama
As both USDT Supply & Borrowing have declined slowly, the StableCoin utilization ratio has been relatively stable around 50-60%.
Data Source : DefiLlama
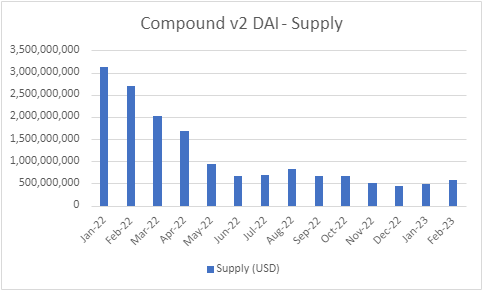
DAI Supply follows the same pattern as USDC. The decentralized stablecoin supply is also in the same levels as its centralized peer.
DAI Supply on Compound however crossed below 1B USD sooner than USDC and without the impact of a cannibalization effect.
Data Source : DefiLlama
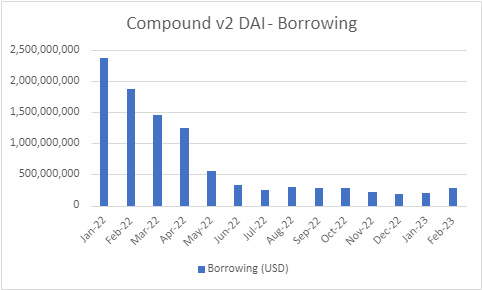
Similar to USDC, DAI borrowing has been stable since summer 22. One of the drivers of stablecoins borrowing on Compound is recursive farming. Users deposit and borrow the same stablecoin and collect COMP rewards without any price risk.

DAI utilization ratio patterns are similar to USDC this could be due to using USDC and DAI interchangeably in COMP recursive farming.
Focus 2 : USDC Market : v2 vs v3
Data Source : DefiLlama
Over the last 6 months, Compound had between 700m-1B USD in USDC supplied on v2 & v3 combined.
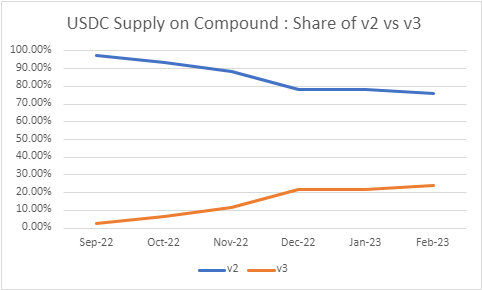
Data Source : DefiLlama
Over the last 3 months, v3 had around 20% of USDC supply on Compound.
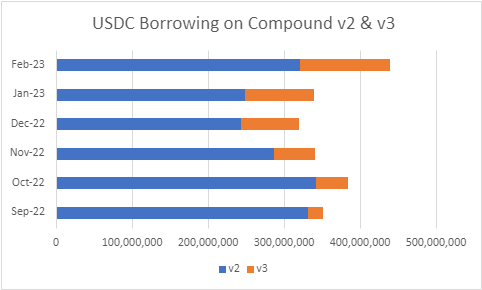
Data Source : DefiLlama
Over the last 6 months, 300-400m USDC was borrowed from Compound accounting for around 50% of the protocol’s total borrowing volumes.
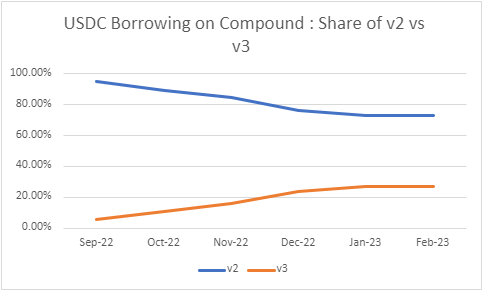
Data Source : DefiLlama
Over the last three months, v3 accounted for around 25% of USDC borrowing on Compound.